
An honest OTel diet for a one-box blog
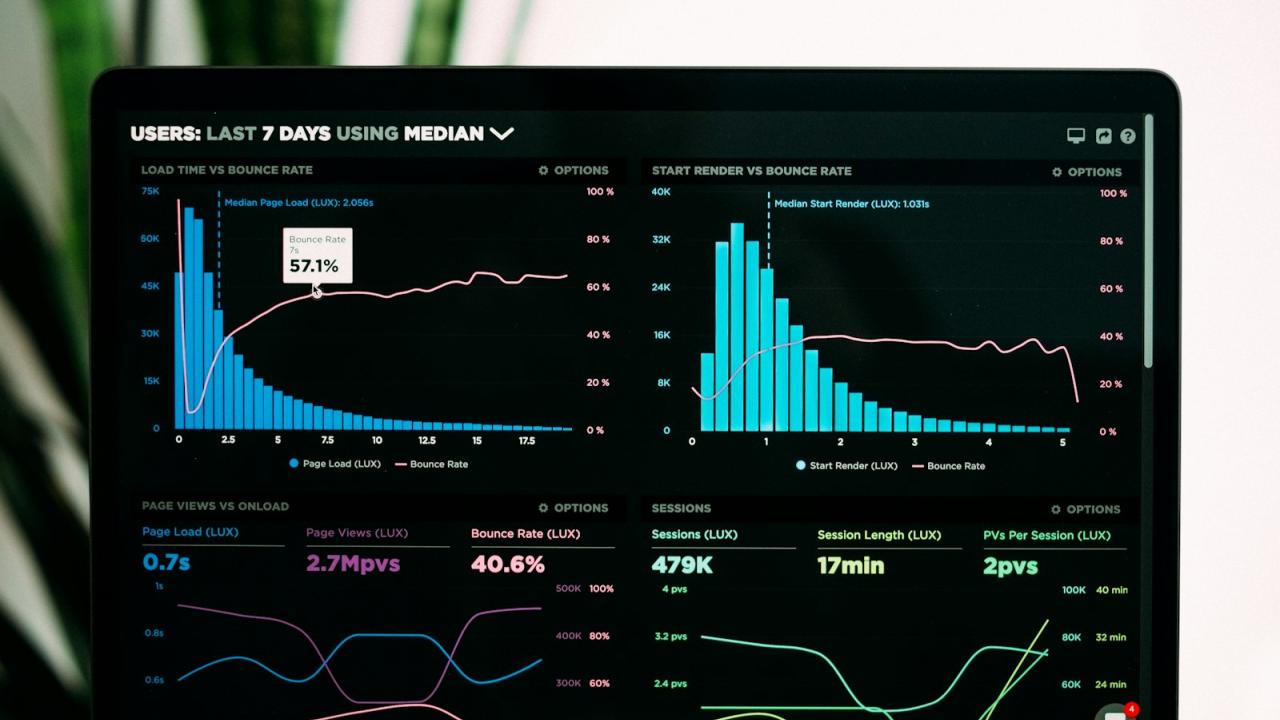
Observability tooling loves to sell you the full three-course meal: logs, metrics, and traces, ideally across a fleet of microservices. My blog is one PHP process talking to one database on one VPS. Pointing a distributed-tracing stack at it is like installing air-traffic control for a single paper plane. Here's the honest diet I settled on, and what I deliberately left off the plate.
The heavy option, and why it's overkill here
The default open-source answer is the Grafana LGTM stack — Loki for logs, Grafana for dashboards, Tempo for traces, Mimir (or Prometheus) for metrics. It's powerful and it's the industry standard. It's also four-to-six separate systems, each with its own storage, config, and upgrade cycle, and on a single 2–4GB VPS that's a lot of machinery running to observe a trickle of telemetry.
The lighter contender I looked at is OpenObserve: one Rust binary that does logs, metrics, and traces, storing everything as Parquet on cheap object storage or local disk, queryable with plain SQL and PromQL. In single-node mode it's genuinely modest, and "one process instead of six" is a real operational win. (Its "140x cheaper than Elasticsearch" line is its own marketing, so take that with the usual salt — but the single-binary simplicity is legitimate.) If I wanted centralized everything on one box, it's a sane pick.
But the real question isn't which tool — it's which signals
Here's the contrarian bit. Distributed tracing exists to follow one request as it hops across services. My blog has no hops. A "trace" of a Drupal page request is: PHP ran, PHP queried the database, PHP rendered. That's not a distributed call graph — it's a slow-query log and one duration number wearing a costume. Instrumenting Drupal with OpenTelemetry (the contrib module exists, and it even wants a PECL C extension for auto-instrumentation) to produce spans for a single-process app is real overhead — a collector, per-request span export, a C extension to maintain — to learn something a slow-query log already tells me.
Tracing answers "which service was slow?" On a one-box blog there is only one service. You already know the answer; you're paying RAM to have it confirmed with a flame graph.
What actually earns its place
Two things, and they're cheap:
- Centralized log search. nginx/Apache access and error logs, PHP-FPM errors, Drupal's dblog (better shipped to syslog), and the MySQL slow-query log — all searchable in one place with a bit of retention on disk. This is the thing you actually reach for when a request 500s at 2am: "what happened, and why." It's the whole value.
- A handful of RED metrics — Rate, Errors, Duration — which you can derive from the nginx access log alone. Requests per second, the 4xx/5xx rate, and p50/p95 latency per URL tell you almost everything about whether the site is healthy, with zero app instrumentation.
That's it. Logs answer "what broke," RED answers "is it broken," and neither needs a tracing pipeline.
How it stacks with what I already run
I've already got Beszel handling lightweight system metrics — CPU, memory, disk, per-container, "is the machine healthy." This post is the other half: logs answer "what happened / why did that request fail," and Beszel answers "is the box OK." Together they cover a solo blog completely. So the honest stopping point for a one-box Drupal site is: Beszel for system health, plus basic centralized log search (OpenObserve single-node if you want a real UI, or even just grep and lnav on the box), plus RED-from-access-logs. No tracing. No always-on OTel.
The nice escape hatch: OpenObserve speaks OTLP natively, so on the rare day you're actually chasing a slow page, you can flip on Drupal's OTel instrumentation temporarily — ideally locally in DDEV — point the spans at the same box, get your one-time flame graph, and turn it back off. That's the right use of tracing for a site like this: a debugging tool you pick up and put down, not infrastructure you run forever. Everything past that is complexity you'll pay for in RAM and never actually read.